My Role: Creation of an information visualization to explain the functionality of Bitcoin. This included the construction of all graphics as well as the corresponding explanations
Team Partner: Marcus Wild
Used Tools: ProCreate, Adobe Illustrator, Photoshop and Google Forms
Duration: 1 Semester
The cryptocurrency Bitcoin is becoming increasingly popular in many areas of the economy.
Nevertheless, the knowledge about the digital currency is often limited to a few buzzwords,
the price and the existence of the digital coins.
By searching for deeper information about cryptocurrency on your own, you will realize the complexity of this topic soon.
This complexity brings a deterrent effect and can lead to a rejection of the digital currency.
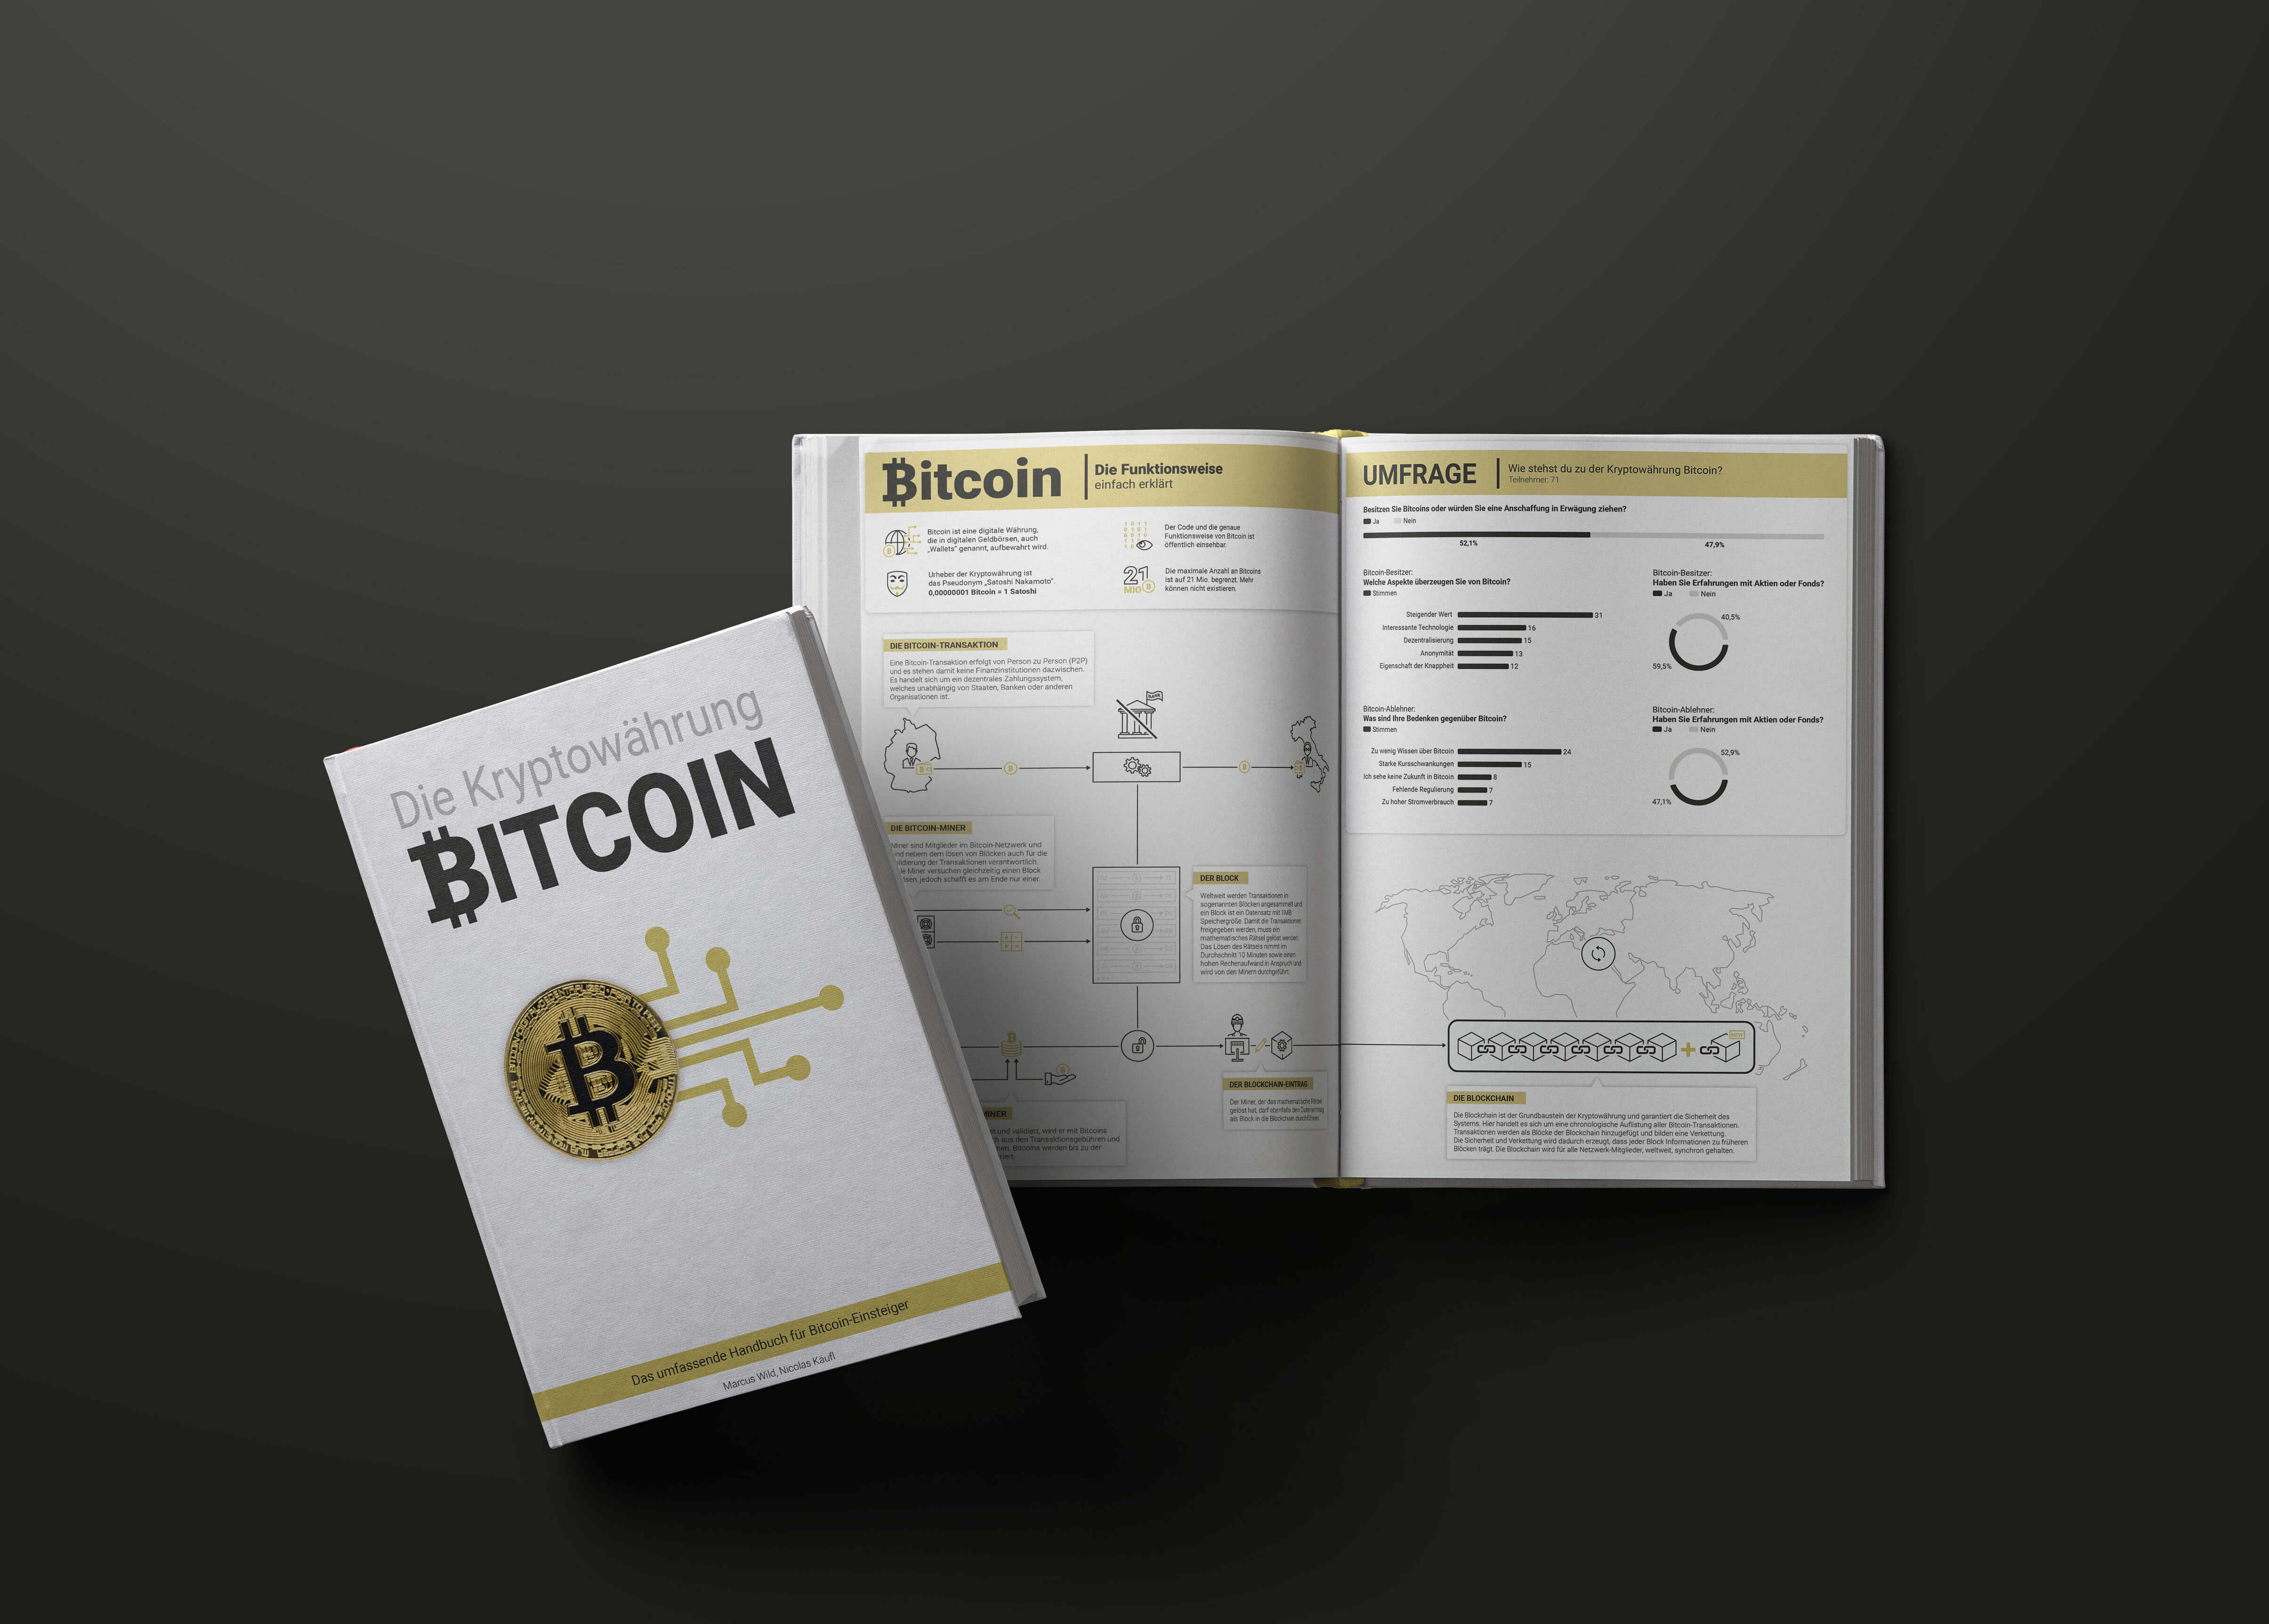
In this project, we created an information visualization for Bitcoin beginners and enthusiasts,
which is embedded in a specialized book.
The visualization should provide an explanatory function and inform the viewer.
Our goal was to present the complexity behind Bitcoin in an easy understandable
and clearly structured way. With the help of an information visualization, Bitcoin
beginners should get a basic and still multifaceted understanding about Bitcoin.
We want to guide beginners through the important processes of the cryptocurrency as effectively as possible,
but experienced people should also be able to learn something with our graphic.
We decided to include the information visualization in a Bitcoin-specialized book. Our work aims to illustrate the content of the book and provide additional understanding. A specialized book targets a broad readership interested in Bitcoin, including both beginners and experienced Bitcoin users. This approach allows us to reach a diverse audience.
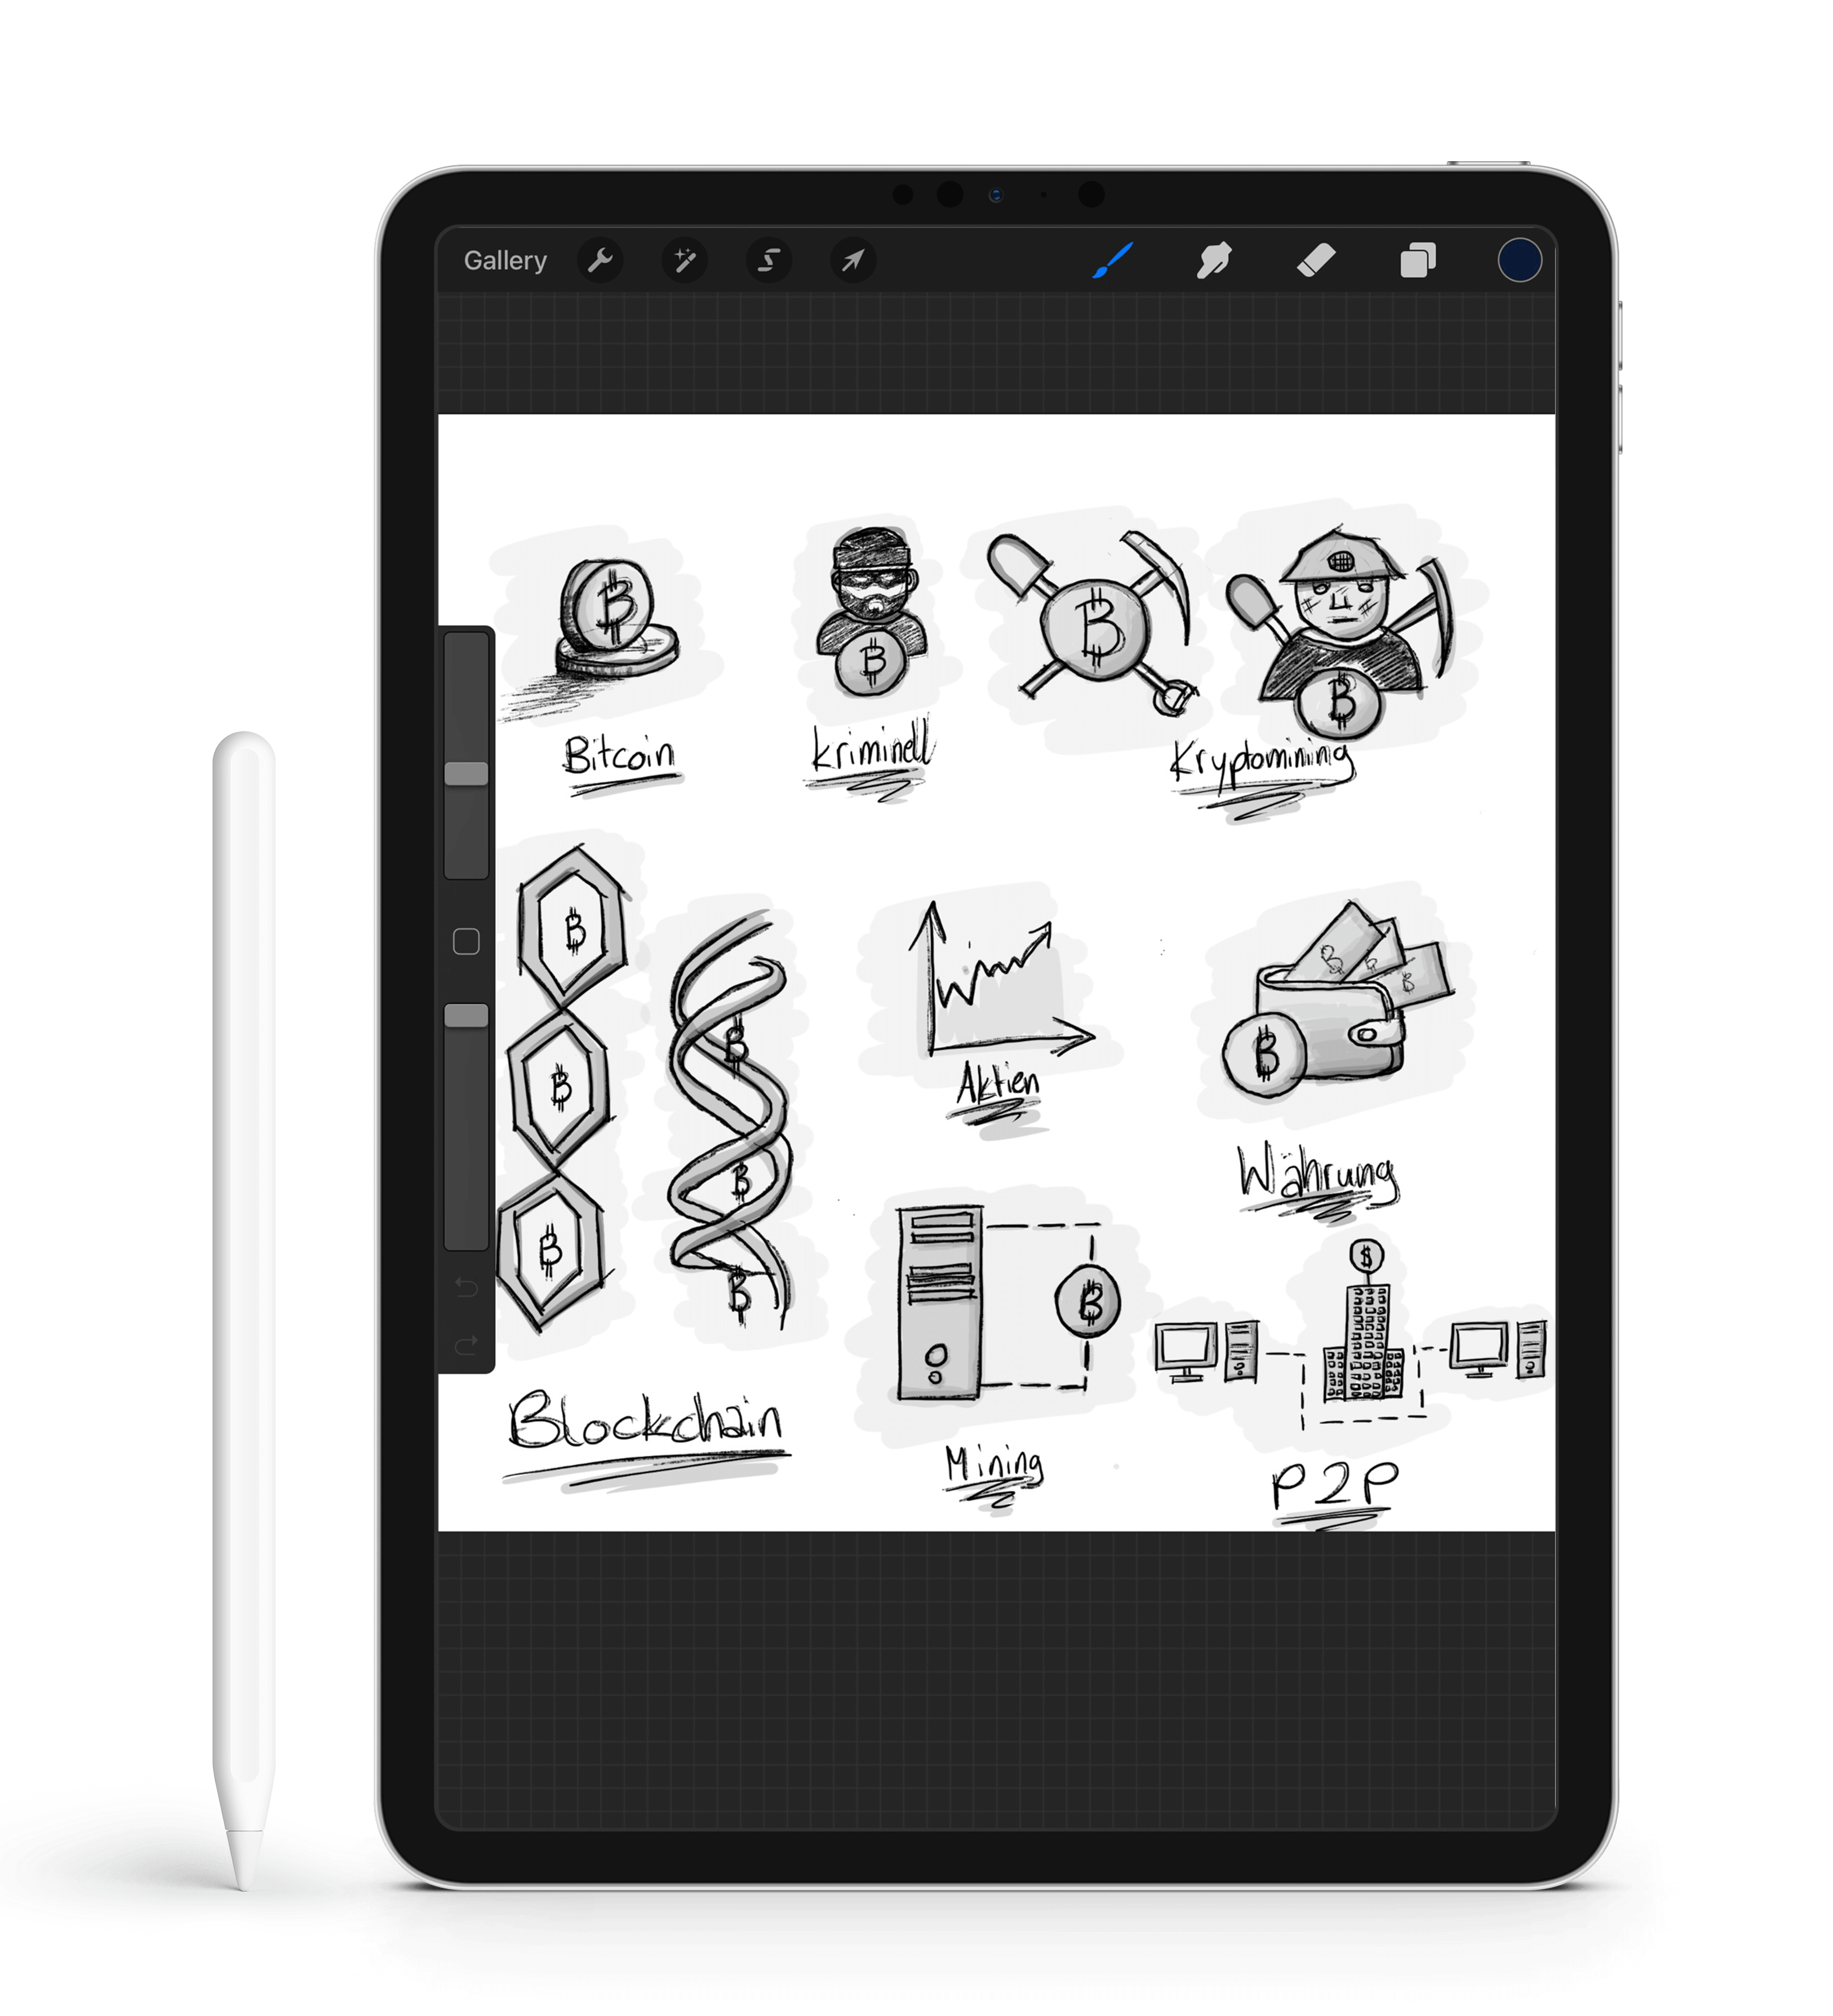
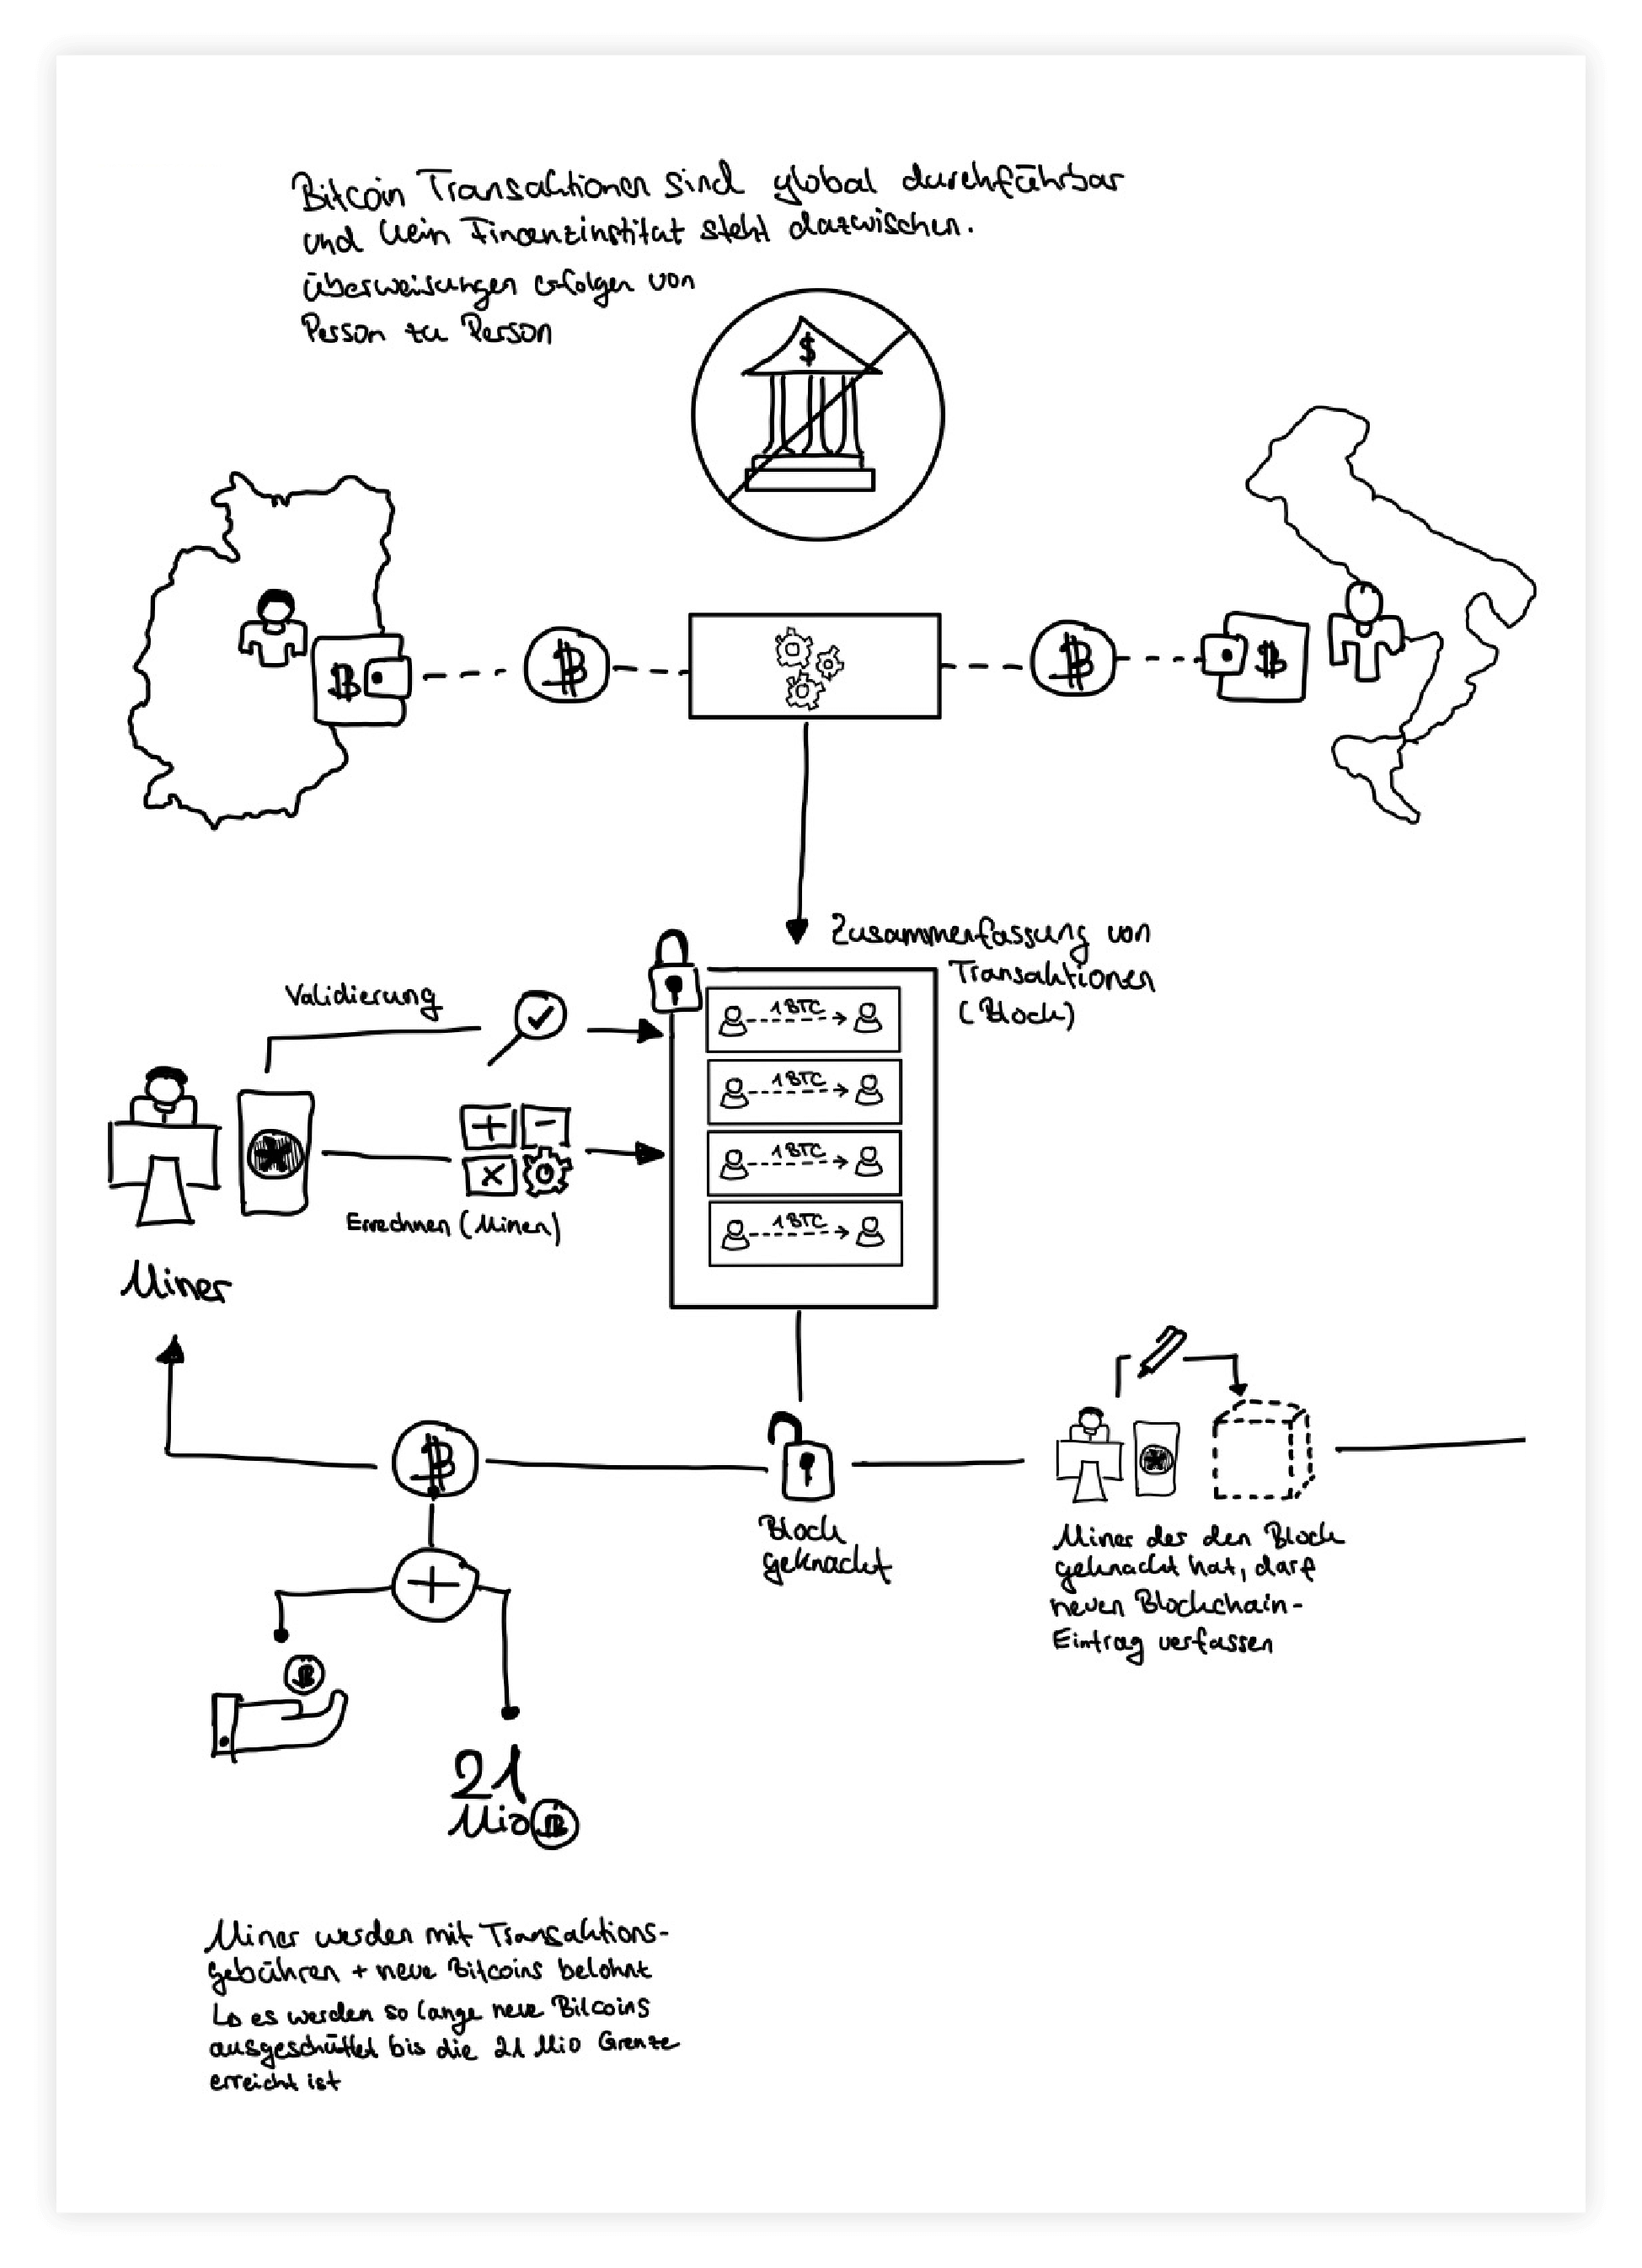
In order to collect a wide range of ideas for the visualization, we sketched various visions at the beginning. We gradually approached suitable illustrations and showed them to other people to get feedback.
In this way, we created step by step effective graphics and supportive metaphors. Each illustration was subsequently discussed and optimized in detail.
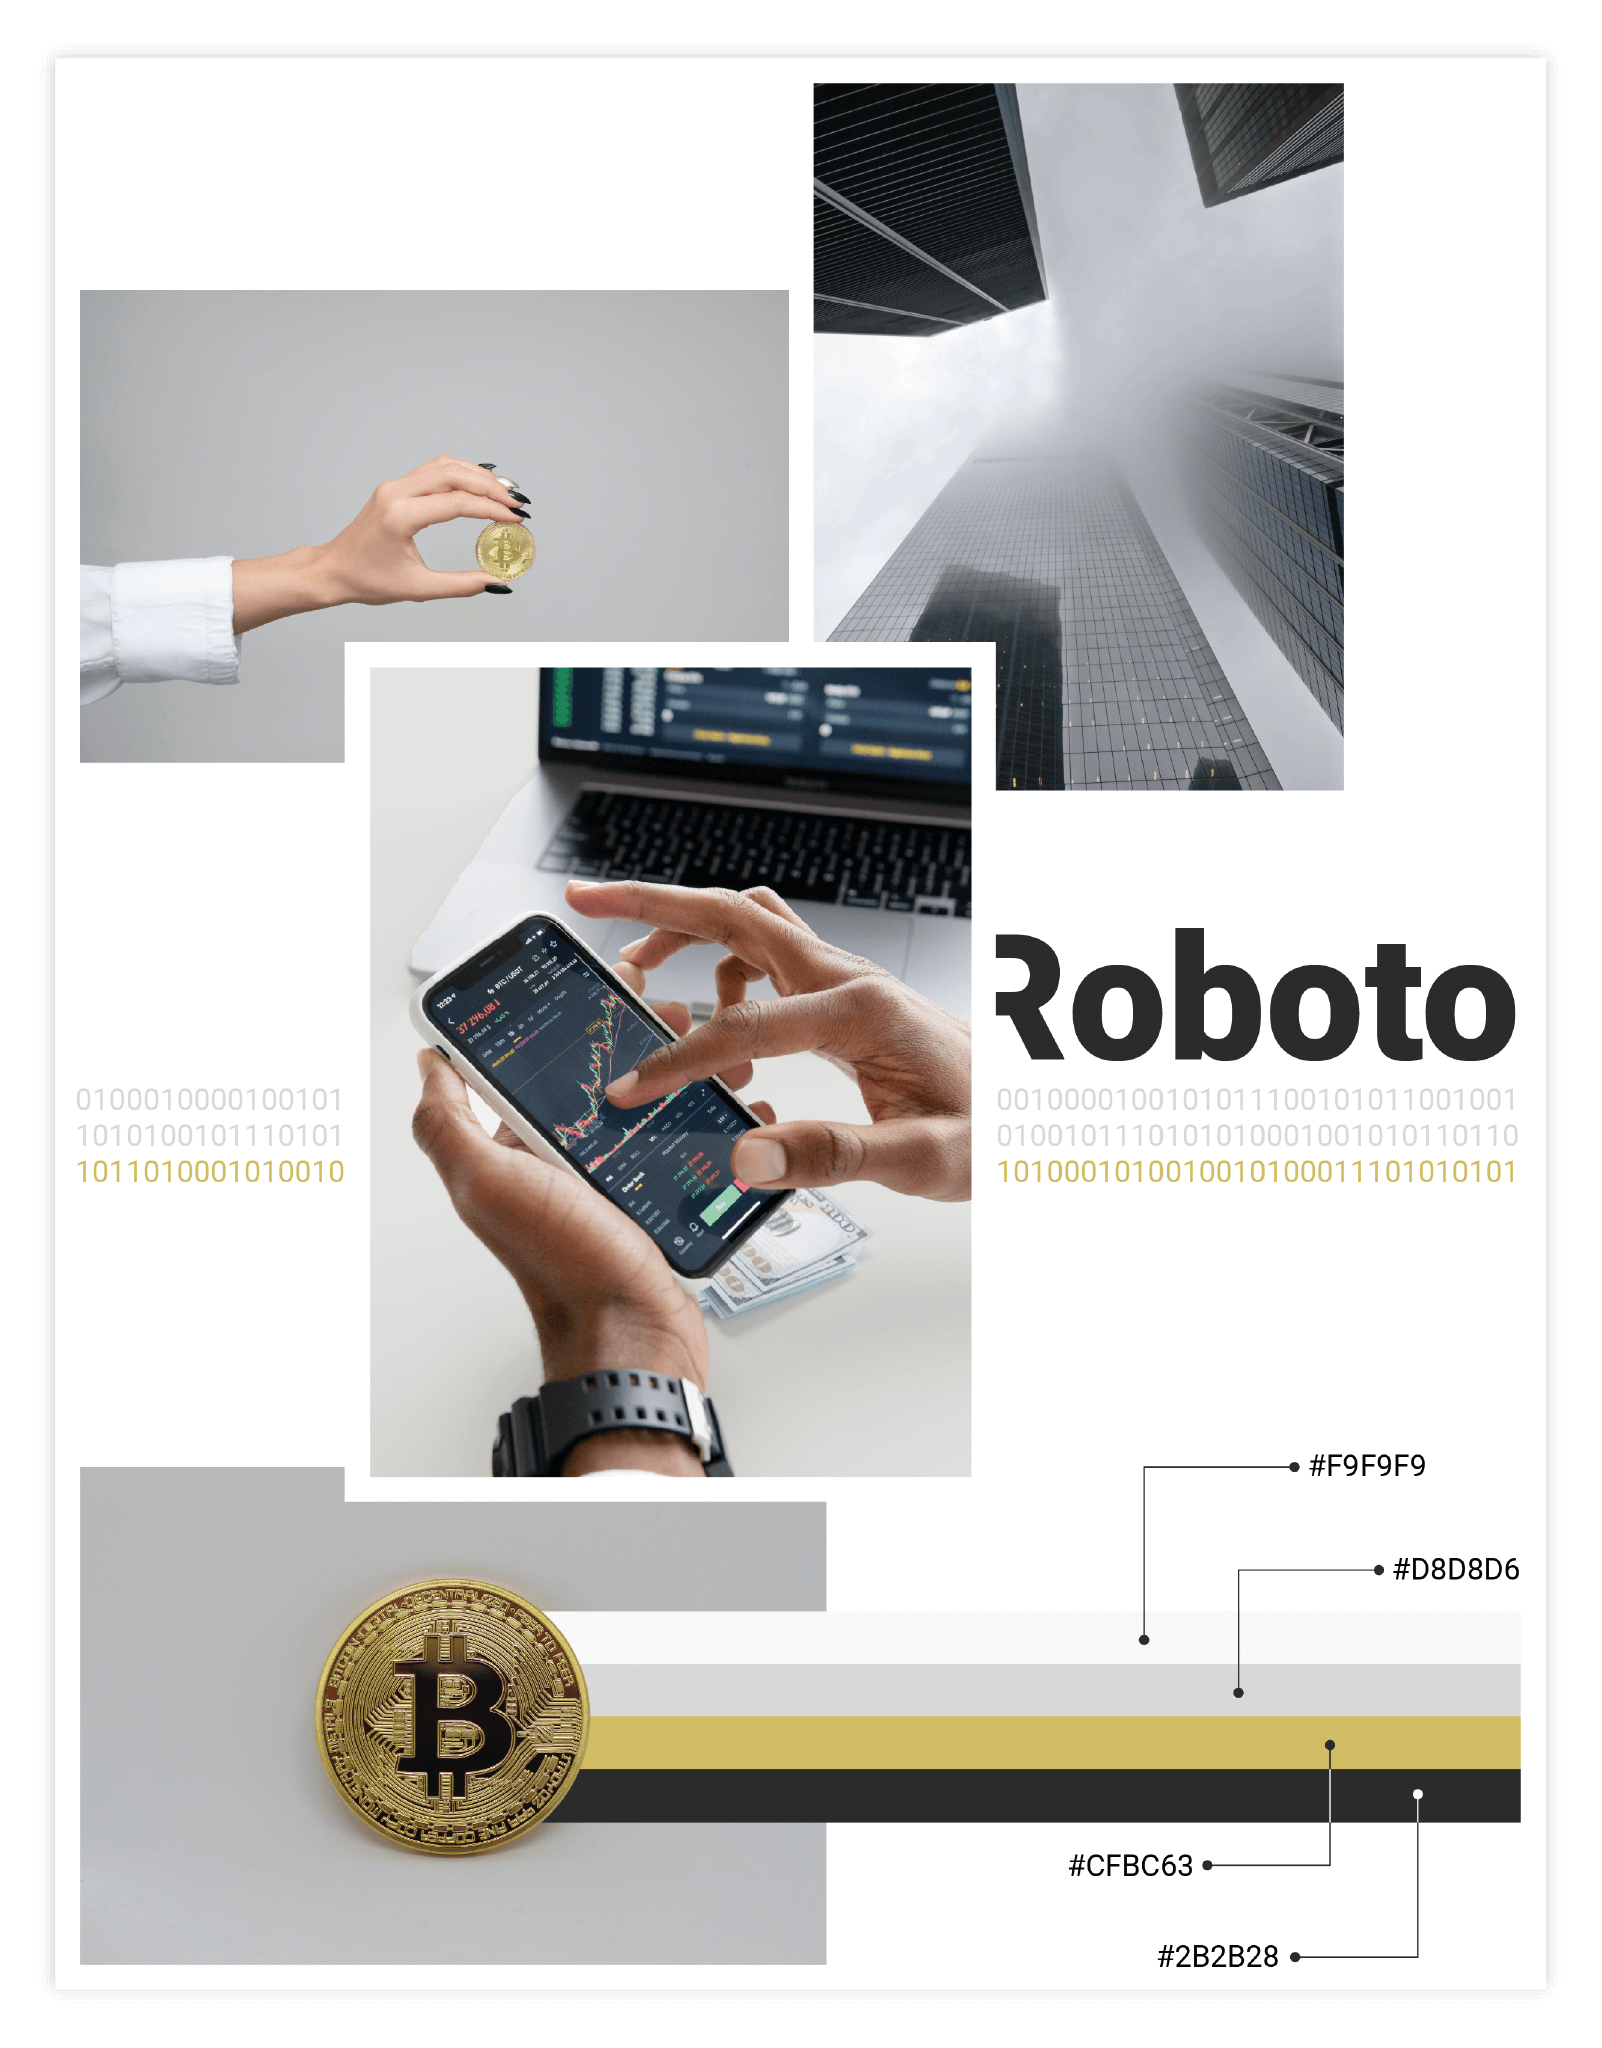
As we are dealing with a financial topic, a professional, serious and formal appearance is necessary.
However, to attract Bitcoin beginners, we also want to look communicative, open and
modern. We accomplish this expression with a combination of black, gray and gold.
The discreet gray tones in combination with black convey the objectivity of our theme. Gold expresses
openness, communication and value. Furthermore, we pick up that Bitcoin is often compared to gold.
For our illustration, we decided to use the font "Roboto". The typography adds a technical geometry as well as numerous font weights. The look of Roboto underlines the overall context of our visualization and creates a professional and technical appearance.
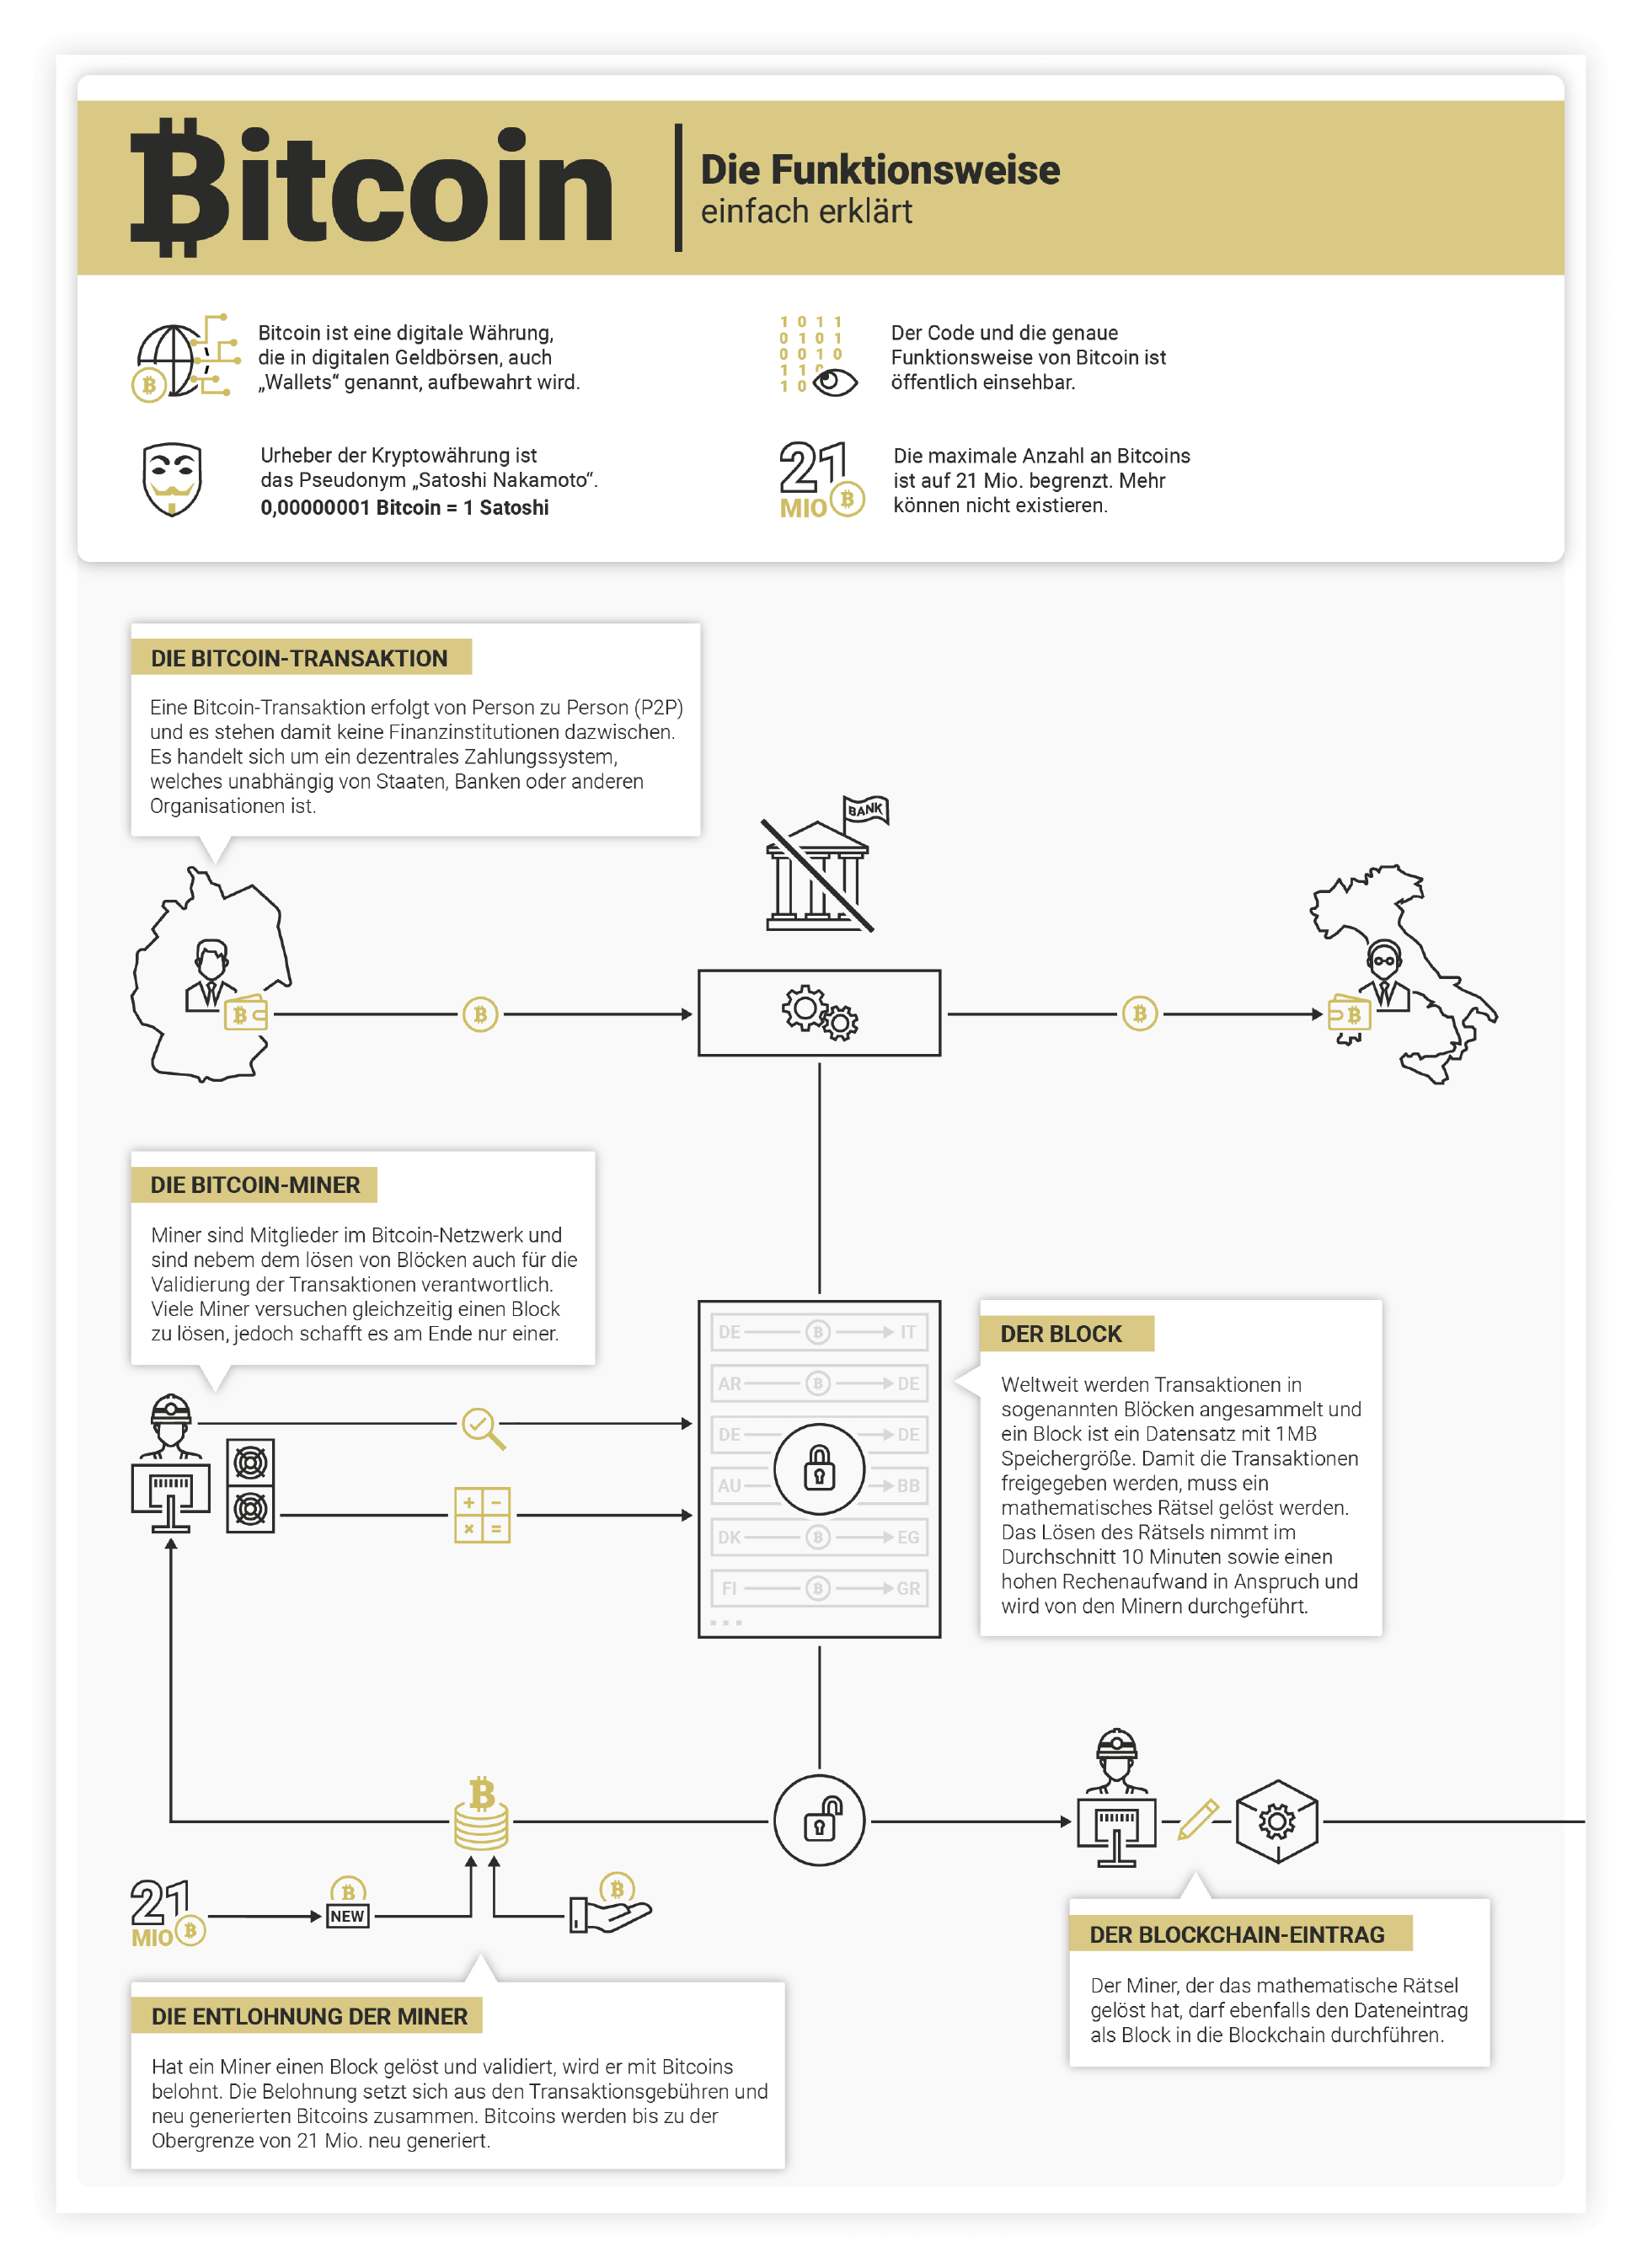
The information visualization covers two pages and brings together the Bitcoin explanation
with the results of a survey we created. We describe the individual Bitcoin facets with clear texts
and emphasize the written content with meaningful illustrations.
The black and gold tones run
consistently through the entire design and create a modern and serious effect with reduced metaphors.
We included a survey to reflect the thoughts of the society and to objectively present the technology. Thus, the readers get neutral insight into positive and negative aspects of Bitcoin besides the actual explanation of the topic. They will be informed about how Bitcoin works and can form their own opinion.